
Etna Elementary Weather Station
The Davis Weather Station located on top of Etna Elementary started observing on October 12,2010 and has the longest uninterrupted record of the three new stations in the Lower Star Valley. The data collected from the Etna station includes temperature, humidity, precipitation, wind direction and speed along with the barometric pressure.
The purpose of this post is to review the conditions that have occurred since the station was established, with emphasis on the most recent 12 months.
The first graph will show the maximum and minimum temperatures for the first 12 months of the station beginning October 2010

This next graph displays the maximum and minimum temperatures for the most recent 12 month period through the end of April 2012

Relative humidity, which is a function of both the temperature and the moisture(dew point), remains consistently higher throughout the colder months.

The weather station also measures both the indoor temperature and humidity at the location of the station console. In the case of Etna this is in the administration office. As would be expected, the temperatures year around remain at a comfortable level. However, in the winter months the actual water vapor in the air is quite low, even though the outside relative humidity is typically high.
This results in very low indoor humidity in the cold months. Comparing inside/outside relative humidity dramatically illustrates this.

It is very interesting to look at a cold week beginning January 9, 2012.

The red line represents the outside temperature with the orange representing the inside temperature. Note the indoor relative humidity represented by the yellow line on the graph. While the indoor temperature remains around 80F the entire week, the indoor relative humidity rises/falls in concert with the outside temperature. For the entire week the indoor humidity rises no higher than 10 percent, while on the coldest day it drops to as low as nearly 0 percent! This provides an environment drier than the desert in the heat of the summer!
This is likely typical of any heated building or home in the winter months in Star Valley. One can conclude that it would be of importance to provide an artificial source of moisture via humidifiers to improve the indoor environment.
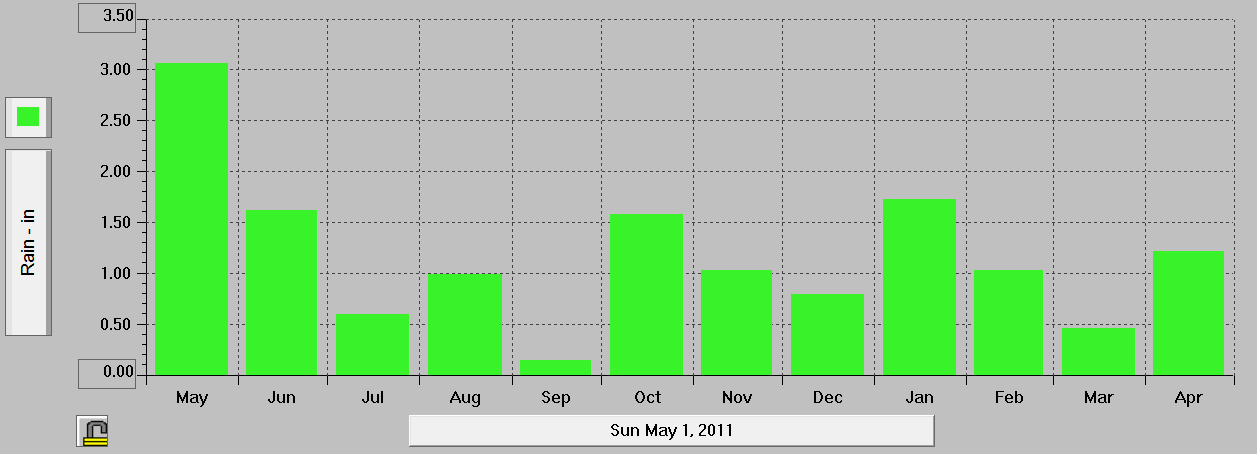
The Etna Rain Gauge has a heater installed, melting the snow that is caught. The problem during the Winter since the gauge is on the roof of the school the wind that typically accompanies the snow reduces the amount that is actually caught and measured. Thus the most reliable measurements would occur in the warmer months when precipitation is liquid. The bar graph below shows the monthly precipitation caught:
The weather station also computes the wind run:

Wind run is a meteorological term used to categorize or determine the total distance (or amount) of the traveled wind over a period of time. The readings are collected using an anemometer.
Wind run can help to determine the rate of evaporation of moisture over a particular area.
From the data Spring seems to be the windiest period with the least this past December. The winter low in wind run is reasonable given the amount of time the valley is under an inversion, when winds typically are very light.
The weather station also keeps track of the highest daily wind gust

In the past 12 months there were two times when the wind gusted above 50 mph. During the cold of December when inversions dominated, winds typically were under 10 mph.
The software associated with the weather station also provides annual summary charts.
These are the charts for 2011, the first full year of the Etna School Station


