Another Significant Advancement in Climate Link
The Climate link for Starvalleyweather.com has again undergone a major upgrade. Now instead of just using the 3SE Bedford climatological station an additional 23 stations have been added by John Hart covering a good portion of Western Wyoming.
The use of the site remains as the original blog from 2012 but now applies to all the additional stations. The period of record varies but many have been active for several decades. To see the period of record for each site check out the blog at
/2013/10/01/climate-stations-period-of-record/
In review as an example, the climate section links to the 3SE Bedford climatological station. The record for this station covers the period from 1975 until the current year. To look at the official data of 3SE Bedford station you can go to this site:
http://www.wrcc.dri.edu/cgi-bin/cliMAIN.pl?wy0603
Following is a discussion of what information is now available at this link:
http://www.starvalleyweather.com/climate.php
 |
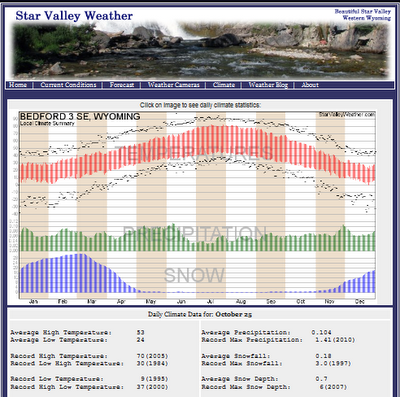
The Climate data defaults to the current days information, in this example for October 25th.

In addition to the average high and low temperature, it displays warmest and coldest maximum and minimum for the day. The precipitation section displays not only the average for the day but the maximum observed since 1975. It is the same for the snowfall, the daily average and maximum observed along with the year of occurrence.
Average snow depth since 1975 along with the greatest measured in the period of record and year of occurrence is also shown.
The temperature graph :

The color portion displays the average maximum and minimum for each day of the year. In addition, the record maximum and minimum temperature is plotted for each day. As an example, the highest temperature since 1975 occurred on June 11 2001 when the thermometer hit 97. The lowest was -38 on January 1,1979.
The precipitation graph:

displays the daily average. Based on this graph the wettest periods are late Spring and again late November/early December.
The snow graph:

shows the average observed snow depth for each day since 1975. Typically the greatest depth is observed late in February and early March. This obviously varies somewhat from year to year.
One final feature of the page is the ability to see each days climate statistics just by clicking on any portion of the image.

To return daily climate stats back to the current day……… just reload.
On another note, a correction was made to the program at the current condition link below:
http://www.starvalleyweather.com/current.php
Thus it will readily respond to scrolling the cursor across the temperature/wind/rainfall links.