California Drought Update
Another Dry California Precipitation Season Draws to a Close
By: Christopher C. Burt , 7:02 PM GMT on June 30, 2015
Another Dry California Precipitation Season Draws to a Close
The 2014-2015 precipitation season ended today (June 30th) and the drought continues unabated. Although the precipitation totals for the July 1-June 30 (2014-2015) period do not appear to be all that bad (generally 60-85% of average) this does not tell the whole story. A very wet December saved what otherwise would have been a catastrophically dry year. In fact, the past six months (since January 1st) have been one of the driest such periods on record for many locations, including San Francisco where it has been the driest start to a year on record (since 1850). Here are some details about the past rainy season and the current drought.
Precipitation for the Season of 2014-2015 in California
There is some confusion about just what the ‘water year’ comprises of in California. In general the USGS uses the period of October 1–September 30 as a ‘water year’ for the western Plains and regions west of there, including California. However, most climatologists in California use the period of July 1-June 30 to define the annual statistical precipitation summaries since, for most of the state, about 90% of the precipitation total occurs between October and May inclusive. For more about this issue read this interesting article on the subject.
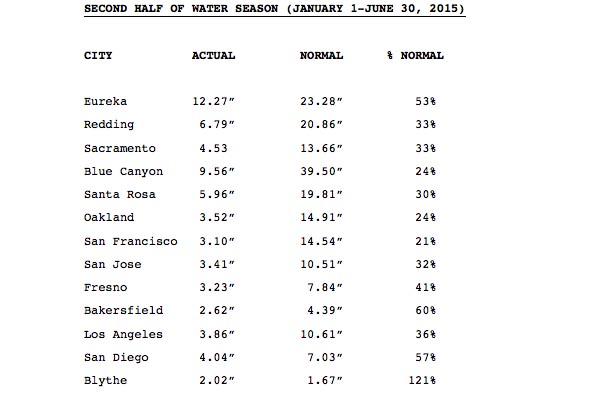
In any case, I use the July 1-June 30 period for defining the California precipitation/water year. Below are three tables of how various sites across the state fared this past season. The first table is for the first half of the water year (July 1-Dec.31), the second table the second half of the water year (Jan. 1- June 30), and the third for the entire water year of 2014-2015 (July 1-June 30):


The ‘normal’ precipitation amounts are based upon the POR of 1981-2010. Blue Canyon is a site located in the central Sierra Nevada at an elevation of about 5,000’ feet. Its normal seasonal snowfall is around 250”. This past winter less than 100” accumulated. Note how this past water season has actually been even drier than that of the 2013-2014 season at the site (which is in parentheses). Blythe is in the state’s desert southeast along the Colorado River border with Arizona.
As one can see, the first half of the water season saw above normal precipitation almost state-wide and the second half MUCH below normal precipitation everywhere except the desert southeastern region. The month of December alone accounted for as much as half of the total water season precipitation for many sites (in San Francisco 11.70” out of a total of 18.19”, or 64% of the total, fell in just December 2014) thanks to a series of powerful Pacific storms that came ashore between November 30th and December 18th. The unusually wet December dented the drought situation and brought hope that the end of such was in sight. But, by late that month, the so-called ‘Ridiculously Resilient Ridge’ (RRR) re-established itself in the Eastern Pacific and didn’t relent for the rest of the water season. January was the driest such on record for the state and, for the first time since records began in 1849, no measureable rain fell in San Francisco for the entire month. There was only one significant precipitation episode in early February and then that was it. In fact, the last half of the water season (Jan. 1-June 30) has been the driest such period on record for San Francisco with a paltry 3.10”, surpassing the previous driest such period set just two years ago in 2013 when 3.51” accumulated (this is out of 165 seasons dating back to 1849-1850).
This has now become the fourth consecutive water season with below normal precipitation. The cumulative effect of this can be appreciated in the map below which shows the gross actual precipitation deficit in inches over the entire past four season period (from July 1, 2011-June 30, 2015) for sites across the state:

The red figures over the Sierra Nevada are the deficit amounts for each Sierra regional district (northern, central, and southern Sierra Nevada). As you can see, (if you compare to what a single normal season should produce in the table earlier) the amount of the deficit is now greater than what an entire normal season should produce. In other words, it is going to take more than one or two good wet seasons to dig out of the drought. Map courtesy of Jan Null at Golden Gate Weather Services.
The Drought Worsens
It is the dryness of the past six months that has created what is now an unprecedented drought emergency across California. In fact, the portion of the state enduring D4 ‘exceptional drought’ conditions is now considerably greater than it was at this time last year:


Latest drought monitor map (top) compared to last year at this time (bottom map). Note how 46.73% of the state is now enduring exceptional drought conditions compared to 32.98% at the same time last year.
The worsening situation is also reflected in reservoir levels as well. Below are conditions currently compared to levels one year ago.


Needless to say, state water officials are taking unprecedented action to control the use of water. For the first time in the state’s history, they are “targeting” long-held and previously inviolable private water rights that date back to before 1914, when the first state regulatory system was put in place. Lawsuits are pending. It will be a long dry summer and hopes run high that a developing, possibly strong, El Nino may bring some relief this coming season.
For the best coverage of the California drought situation (from a climatological viewpoint) one can do no better than to follow Daniel Swain’s California Weather Blog here. Daniel’s research at Stanford University on the subject of California’s perennial droughts has been ground-breaking.
Christopher C. Burt
Weather Historian
The 2014-2015 precipitation season ended today (June 30th) and the drought continues unabated. Although the precipitation totals for the July 1-June 30 (2014-2015) period do not appear to be all that bad (generally 60-85% of average) this does not tell the whole story. A very wet December saved what otherwise would have been a catastrophically dry year. In fact, the past six months (since January 1st) have been one of the driest such periods on record for many locations, including San Francisco where it has been the driest start to a year on record (since 1850). Here are some details about the past rainy season and the current drought.
Precipitation for the Season of 2014-2015 in California
There is some confusion about just what the ‘water year’ comprises of in California. In general the USGS uses the period of October 1–September 30 as a ‘water year’ for the western Plains and regions west of there, including California. However, most climatologists in California use the period of July 1-June 30 to define the annual statistical precipitation summaries since, for most of the state, about 90% of the precipitation total occurs between October and May inclusive. For more about this issue read this interesting article on the subject.
In any case, I use the July 1-June 30 period for defining the California precipitation/water year. Below are three tables of how various sites across the state fared this past season. The first table is for the first half of the water year (July 1-Dec.31), the second table the second half of the water year (Jan. 1- June 30), and the third for the entire water year of 2014-2015 (July 1-June 30):
The ‘normal’ precipitation amounts are based upon the POR of 1981-2010. Blue Canyon is a site located in the central Sierra Nevada at an elevation of about 5,000’ feet. Its normal seasonal snowfall is around 250”. This past winter less than 100” accumulated. Note how this past water season has actually been even drier than that of the 2013-2014 season at the site (which is in parentheses). Blythe is in the state’s desert southeast along the Colorado River border with Arizona.
As one can see, the first half of the water season saw above normal precipitation almost state-wide and the second half MUCH below normal precipitation everywhere except the desert southeastern region. The month of December alone accounted for as much as half of the total water season precipitation for many sites (in San Francisco 11.70” out of a total of 18.19”, or 64% of the total, fell in just December 2014) thanks to a series of powerful Pacific storms that came ashore between November 30th and December 18th. The unusually wet December dented the drought situation and brought hope that the end of such was in sight. But, by late that month, the so-called ‘Ridiculously Resilient Ridge’ (RRR) re-established itself in the Eastern Pacific and didn’t relent for the rest of the water season. January was the driest such on record for the state and, for the first time since records began in 1849, no measureable rain fell in San Francisco for the entire month. There was only one significant precipitation episode in early February and then that was it. In fact, the last half of the water season (Jan. 1-June 30) has been the driest such period on record for San Francisco with a paltry 3.10”, surpassing the previous driest such period set just two years ago in 2013 when 3.51” accumulated (this is out of 165 seasons dating back to 1849-1850).
This has now become the fourth consecutive water season with below normal precipitation. The cumulative effect of this can be appreciated in the map below which shows the gross actual precipitation deficit in inches over the entire past four season period (from July 1, 2011-June 30, 2015) for sites across the state:
The red figures over the Sierra Nevada are the deficit amounts for each Sierra regional district (northern, central, and southern Sierra Nevada). As you can see, (if you compare to what a single normal season should produce in the table earlier) the amount of the deficit is now greater than what an entire normal season should produce. In other words, it is going to take more than one or two good wet seasons to dig out of the drought. Map courtesy of Jan Null at Golden Gate Weather Services.
The Drought Worsens
It is the dryness of the past six months that has created what is now an unprecedented drought emergency across California. In fact, the portion of the state enduring D4 ‘exceptional drought’ conditions is now considerably greater than it was at this time last year:
Latest drought monitor map (top) compared to last year at this time (bottom map). Note how 46.73% of the state is now enduring exceptional drought conditions compared to 32.98% at the same time last year.
The worsening situation is also reflected in reservoir levels as well. Below are conditions currently compared to levels one year ago.
Needless to say, state water officials are taking unprecedented action to control the use of water. For the first time in the state’s history, they are “targeting” long-held and previously inviolable private water rights that date back to before 1914, when the first state regulatory system was put in place. Lawsuits are pending. It will be a long dry summer and hopes run high that a developing, possibly strong, El Nino may bring some relief this coming season.
For the best coverage of the California drought situation (from a climatological viewpoint) one can do no better than to follow Daniel Swain’s California Weather Blog here. Daniel’s research at Stanford University on the subject of California’s perennial droughts has been ground-breaking.
Christopher C. Burt
Weather Historian