|
Last Month
|
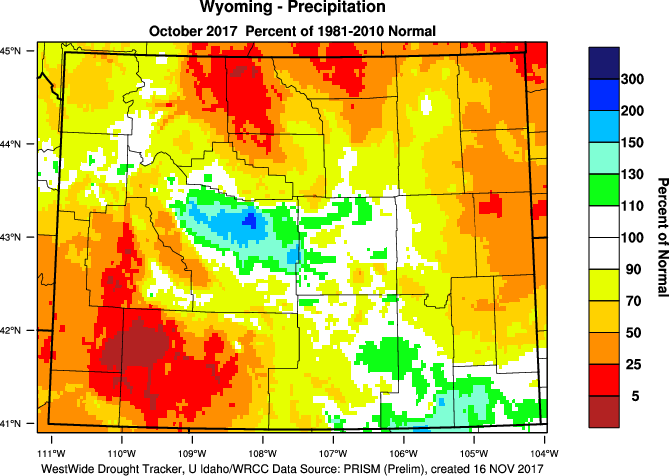
| Precipitation – Percent of Normal |
Temperature – Departure from Normal |
 |
 |
| Statewide Average (inches) |
|
Statewide Average (°F) |
|
| 20th Century Average |
1.84 |
20th Century Average |
57.6 |
| Rank – Driest to Wettest (121 Years) |
|
Rank – Warmest to Coldest (121 Years) |
|
| Rank – Wettest to Driest (121 Years) |
|
Rank – Coldest to Warmest (121 Years) |
|
| Driest Month on Record: Jun 2012 |
0.45 |
Warmest Month on Record: Jun 1988 |
66.4 |
| Wettest Year on Record: Jun 1967 |
4.33 |
Coldest Month on Record: Jun 1951 |
51.5 |
|
|
|
Last 3 Months
|
| Precipitation – Percent of Normal |
Temperature – Departure from Normal |
 |
 |
| Statewide Average (inches) |
|
Statewide Average (°F) |
|
| 20th Century Average |
5.82 |
20th Century Average |
48.3 |
| Rank – Driest to Wettest (121 Years) |
|
Rank – Warmest to Coldest (121 Years) |
|
| Rank – Wettest to Driest (121 Years) |
|
Rank – Coldest to Warmest (121 Years) |
|
| Driest Period on Record: Apr – Jun 1919 |
2.91 |
Warmest Period on Record: Apr – Jun 1988 |
53.1 |
| Wettest Period on Record: Apr – Jun 1957 |
9.32 |
Coldest Period on Record: Apr – Jun 1917 |
43.7 |
|
|
|
2015
|
| Precipitation – Percent of Normal |
Temperature – Departure from Normal |
 |
 |
| Statewide Average (inches) |
|
Statewide Average (°F) |
|
| 20th Century Average |
9.10 |
20th Century Average |
35.8 |
| Rank – Driest to Wettest (121 Years) |
|
Rank – Warmest to Coldest (121 Years) |
|
| Rank – Wettest to Driest (121 Years) |
|
Rank – Coldest to Warmest (121 Years) |
|
| Driest Period on Record: Jan – Jun 1919 |
4.72 |
Warmest Period on Record: Jan – Jun 1934 |
41.5 |
| Wettest Period on Record: Jan – Jun 1899, 1995 |
12.70 |
Coldest Period on Record: Jan – Jun 1917 |
30.3 |
|
|
|
2014-2015 Water Year
|
| Precipitation – Percent of Normal |
Temperature – Departure from Normal |
 |
 |
| Statewide Average (inches) |
|
Statewide Average (°F) |
|
| 20th Century Average |
12.34 |
20th Century Average |
34.1 |
| Rank – Driest to Wettest (120 Years) |
|
Rank – Warmest to Coldest (120 Years) |
|
| Rank – Wettest to Driest (120 Years) |
|
Rank – Coldest to Warmest (120 Years) |
|
| Driest Periods on Record: Oct 1918 – Jun 1919 |
7.12 |
Warmest Period on Record: Oct 1933 – Jun 1934 |
39.7 |
| Wettest Period on Record: Oct 1994 – Jun 1995 |
17.66 |
Coldest Period on Record: Oct 1916 – Jun 1917 |
28.6 |
|
|
|
Last 12 Months
|
| Precipitation – Percent of Normal |
Temperature – Departure from Normal |
 |
 |
| Statewide Average (inches) |
|
Statewide Average (°F) |
|
| 20th Century Average |
15.94 |
20th Century Average |
40.8 |
| Rank – Driest to Wettest (120 Years) |
|
Rank – Warmest to Coldest (120 Years) |
|
| Rank – Wettest to Driest (120 Years) |
|
Rank – Coldest to Warmest (120 Years) |
|
| Driest Period on Record: Jun 1933 – May 1934 |
11.11 |
Warmest Period on Record: Jul 1933 – Jun 1934 |
45.3 |
| Wettest Period on Record: Jul 1994 – Jun 1995 |
20.33 |
Coldest Period on Record: Jul 1916 – Jun 1917 |
36.4 |
|
|
|
Last 5 Years (Aug 2010 – Jul 2015)
|
| Precipitation – Percent of Normal |
Temperature – Departure from Normal |
| Map Not Available For This Period |
Map Not Available For This Period |
| Statewide Average (inches) |
|
Statewide Average (°F) |
|
| 20th Century Average |
79.51 |
20th Century Average |
40.7 |
| Rank – Driest to Wettest (120 Years) |
|
Rank – Warmest to Coldest (120 Years) |
|
| Rank – Wettest to Driest (120 Years) |
|
Rank – Coldest to Warmest (120 Years) |
|
| Driest Period on Record: Jul 1999 – Jul 2004 |
65.21 |
Warmest Period on Record: Jul 2002 – Jun 2007 |
42.8 |
| Wettest Period on Record: Jul 1 |