Total Precipitation Anamolies 1,3 and 6 years
Total precipitation anomaly is calculated by dividing the total precipitation over a specified period of months by the 1981-2010 normal precipitation for the months included in that period.
The calculations use as many as possible of the station networks and data sources ingested by the PRISM Climate Group, not just those that have existed for long periods of time.
The PRISM Climate Group gathers climate observations from a wide range of monitoring networks, applies sophisticated quality control measures, and develops spatial climate datasets to reveal short- and long-term climate pattern.
Following are the maps for the past 1, 3 and 6 years across the United States.
 |
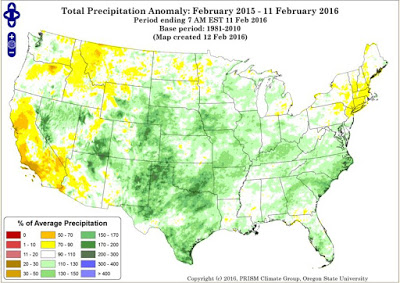
| Feb 2015-11 Feb 2016 |
 |
| Feb 2013- 11 Feb 2016 |
 |
| Feb 2010-11 Feb 2016
The most obvious anomaly is the persistent deficient in precipitation in the Southwestern States in particular California.’
Wyoming has experienced near to slightly below normal for the past 6 years. However in the last 3 years steady improvement has taken place across eastern Wyoming Also significant relief took place last year across Texas west ward to California.
|
 |
| Map of 30 year average annual precipitation |