Water Year as of March 31 2014 for Western Wyoming-Star Valley
 |
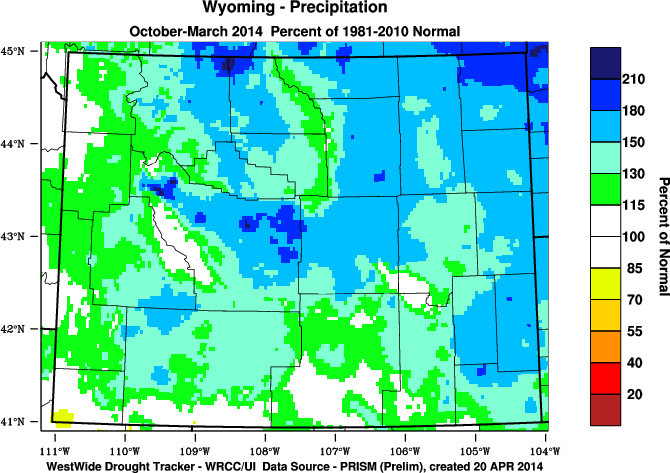
| Percent of Normal Precipitation Oct 2013-March 2014 |
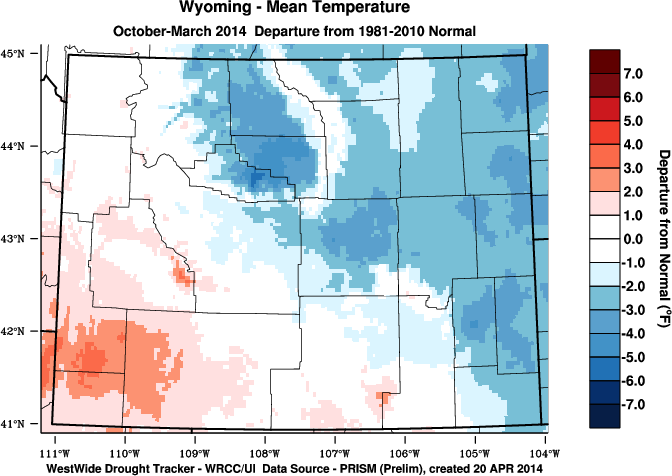 |
| Temperature Departure from Normal Oct 2013-March 2014
It has been a very moist period since actually last September across much of Wyoming. For comparison purposes will compare Star Valley measurements since last October 1st when the current water year began.
Following are the totals from COCoRAHS observers in Star Valley.
Star Valley Ranch had 19.65 inches which included 172.5 inches of snow.
1.5 miles southeast of Thayne had 15.19 inches which included approximately 155 inches of snow.
5 miles southeast of Smoot had 16.70 inches which included 185 inches of snow
Another location on Star Valley Ranch measured 17.12 inches but did not have a snow total.
For comparison purposes the Willow Creek SNOTEL as of March 31 had reported 40.2 inches of precipitation since October 1 2013 along with a snow depth of 107 inches.
Following is a detailed summary of the water year across much of western Wyoming.
|
2013-2014 Water Year Precipitation and Percent of Normal for Selected Stations |
|||||||||||||||||||||||||||||
| Station Name: Airports |
Drought Conditions |
Oct 2013 |
Nov 2013 |
Dec 2013 |
Jan 2014 |
Feb 2014 |
Mar 2014 |
Apr 2014 |
May 2014 |
Jun 2014 |
Jul 2014 |
Aug 2014 |
Sep 2014 |
Total for Water Year |
|||||||||||||||
| click on location | D0 | D1 | |||||||||||||||||||||||||||
| for graph | D2 | D3 | D4 | ||||||||||||||||||||||||||
| Big Piney | None | 0.39 | 0.29 | 0.19 | 0.02 | 0.02 | 0.12 | 1.03 | |||||||||||||||||||||
| 1981-2010 Normals | 0.53 | 0.21 | 0.30 | 0.31 | 0.35 | 0.44 | 0.53 | 0.84 | 0.79 | 0.71 | 0.69 | 0.78 | 2.14 | ||||||||||||||||
| Percent of Normal | 74 | 138 | 63 | 6 | 6 | 27 | 48 | ||||||||||||||||||||||
| Buffalo | None | 2.25 | 0.12 | 0.24 | 0.21 | 0.15 | 0.61 | 3.58 | |||||||||||||||||||||
| 1981-2010 Normals | 0.93 | 0.54 | 0.40 | 0.42 | 0.35 | 0.92 | 1.30 | 2.53 | 2.28 | 1.66 | 0.81 | 1.31 | 3.56 | ||||||||||||||||
| Percent of Normal | 242 | 22 | 60 | 50 | 43 | 66 | 101 | ||||||||||||||||||||||
| Casper | None | 3.03 | 0.24 | 1.20 | 0.74 | 0.74 | 1.64 | 7.59 | |||||||||||||||||||||
| 1981-2010 Normals | 1.11 | 0.76 | 0.49 | 0.51 | 0.57 | 0.82 | 1.29 | 2.02 | 1.61 | 1.41 | 0.85 | 1.08 | 4.26 | ||||||||||||||||
| Percent of Normal | 273 | 32 | 245 | 145 | 130 | 200 | 178 | ||||||||||||||||||||||
| Snowfall | 16.4 | 3.6 | 15.7 | 14.2 | 11.5 | 18.7 | 80.1 | ||||||||||||||||||||||
| 1981-2010 Normals | 7.4 | 10.3 | 11.0 | 9.1 | 9.8 | 10.9 | 11.6 | 2.9 | 0.1 | 0.0 | 0.0 | 1.8 | 58.5 | ||||||||||||||||
| Percent of Normal | 222 | 35 | 143 | 156 | 117 | 172 | 137 | ||||||||||||||||||||||
| Evanston | None | 0.96 | 0.18 | 0.06 | 0.03 | T | 0.08 | 1.31 | |||||||||||||||||||||
| 1981-2010 Normals | 1.17 | 1.04 | 0.58 | 0.54 | 0.61 | 0.86 | 1.15 | 1.77 | 1.24 | 0.61 | 0.96 | 1.31 | 4.80 | ||||||||||||||||
| Percent of Normal | 82 | 17 | 10 | 6 | 0 | 9 | 27 | ||||||||||||||||||||||
| Greybull | None | 1.12 | T | 0.03 | 0.04 | 0.22 | 0.18 | 1.59 | |||||||||||||||||||||
| 1981-2010 Normals | 0.60 | 0.30 | 0.28 | 0.23 | 0.18 | 0.40 | 0.71 | 1.65 | 1.20 | 0.66 | 0.42 | 0.88 | 1.99 | ||||||||||||||||
| Percent of Normal | 187 | 0 | 11 | 17 | 122 | 45 | 80 | ||||||||||||||||||||||
| Station Name: Airports |
Drought Conditions |
Oct 2013 |
Nov 2013 |
Dec 2013 |
Jan 2014 |
Feb 2014 |
Mar 2014 |
Apr 2014 |
May 2014 |
Jun 2014 |
Jul 2014 |
Aug 2014 |
Sep 2014 |
Total for Water Year |
|||||||||||||||
| Lander | None | 3.08 | 0.13 | 0.69 | 0.61 | 0.19 | 1.18 | 5.88 | |||||||||||||||||||||
| 1981-2010 Normals | 1.29 | 0.86 | 0.58 | 0.41 | 0.58 | 1.16 | 1.87 | 2.20 | 1.27 | 0.78 | 0.61 | 1.05 | 4.88 | ||||||||||||||||
| Percent of Normal | 239 | 15 | 119 | 149 | 33 | 102 | 120 | ||||||||||||||||||||||
| Snowfall | 21.9 | 3.5 | 13.1 | 8.9 | 3.8 | 13.9 | 65.1 | ||||||||||||||||||||||
| 1981-2010 Normals | 9.8 | 13.1 | 10.1 | 7.6 | 10.3 | 16.1 | 16.8 | 4.8 | 0.1 | 0.0 | 0.0 | 2.7 | 67.0 | ||||||||||||||||
| Percent of Normal | 223 | 27 | 130 | 117 | 37 | 86 | 97 | ||||||||||||||||||||||
| Riverton | None | 1.94 | 0.03 | 0.28 | 0.68 | 0.22 | 0.50 | 3.65 | |||||||||||||||||||||
| 1981-2010 Normals | 0.89 | 0.50 | 0.32 | 0.24 | 0.27 | 0.55 | 1.30 | 1.72 | 1.28 | 0.89 | 0.57 | 0.90 | 2.77 | ||||||||||||||||
| Percent of Normal | 218 | 6 | 88 | 283 | 81 | 91 | 132 | ||||||||||||||||||||||
| Snowfall | 17.5 | 1.5 | 6.8 | 11.1 | 5.0 | 3.4 | 45.3 | ||||||||||||||||||||||
| Rock Springs | D0 | 0.86 | 0.03 | 0.18 | 0.07 | 0.08 | 0.43 | 1.65 | |||||||||||||||||||||
| 1981-2010 Normals | 0.87 | 0.49 | 0.50 | 0.45 | 0.48 | 0.68 | 0.91 | 1.21 | 0.79 | 0.64 | 0.62 | 0.92 | 3.47 | ||||||||||||||||
| Percent of Normal | 99 | 6 | 36 | 16 | 17 | 63 | 48 | ||||||||||||||||||||||
| Sheridan | None | 2.47 | 0.17 | 1.12 | 0.64 | 1.21 | 1.69 | 7.30 | |||||||||||||||||||||
| 1981-2010 Normals | 1.41 | 0.71 | 0.56 | 0.56 | 0.54 | 0.98 | 1.60 | 2.35 | 2.12 | 1.18 | 0.72 | 1.43 | 4.76 | ||||||||||||||||
| Percent of Normal | 175 | 24 | 200 | 114 | 224 | 172 | 153 | ||||||||||||||||||||||
| Worland | None | 1.78 | 0.12 | 0.12 | 0.25 | 0.13 | 0.40 | 2.80 | |||||||||||||||||||||
| 1981-2010 Normals | 0.69 | 0.35 | 0.23 | 0.23 | 0.19 | 0.46 | 0.86 | 1.42 | 1.15 | 0.71 | 0.43 | 0.85 | 2.15 | ||||||||||||||||
| Percent of Normal | 258 | 34 | 52 | 109 | 68 | 87 | 130 | ||||||||||||||||||||||
| Station Name: COOPS |
Drought Conditions |
Oct 2013 |
Nov 2013 |
Dec 2013 |
Jan 2014 |
Feb 2014 |
Mar 2014 |
Apr 2014 |
May 2014 |
Jun 2014 |
Jul 2014 |
Aug 2014 |
Sep 2014 |
Total for Water Year |
|||||||||||||||
| Afton | None | 2.98 | 0.71 | 0.93 | 1.16 | 2.40 | 1.53 | 9.71 | |||||||||||||||||||||
| 1981-2010 Normals | 1.63 | 2.04 | 1.25 | 1.40 | 1.09 | 1.40 | 1.54 | 2.26 | 1.97 | 1.43 | 1.25 | 1.46 | 8.25 | ||||||||||||||||
| Percent of Normal | 183 | 48 | 74 | 83 | 220 | 109 | 118 | ||||||||||||||||||||||
| Snowfall | 6.5 | 8.5 | 12.3 | 17.3 | 29.0 | 11.3 | 84.9 | ||||||||||||||||||||||
| Bitter Creek 4NE | None | 0.97 | 0.05 | 0.39 | 0.27 | 0.35 | 0.68 | 2.71 | |||||||||||||||||||||
| 1981-2010 Normals | 0.66 | 0.31 | 0.51 | 0.28 | 0.36 | 0.30 | 0.65 | 1.09 | 0.70 | 0.60 | 0.75 | 0.73 | 2.42 | ||||||||||||||||
| Percent of Normal | 147 | 16 | 76 | 96 | 97 | 227 | 112 | ||||||||||||||||||||||
| Cody | None | 1.41 | 0.30 | 0.42 | 0.93 | 1.78 | 0.55 | 5.39 | |||||||||||||||||||||
| 1981-2010 Normals | 0.89 | 0.48 | 0.33 | 0.33 | 0.33 | 0.56 | 1.06 | 1.82 | 1.68 | 1.11 | 0.91 | 1.06 | 2.92 | ||||||||||||||||
| Percent of Normal | 158 | 63 | 127 | 282 | 539 | 98 | 185 | ||||||||||||||||||||||
| Snowfall | 7.0 | 4.0 | 6.5 | 20.0 | 29.0 | 3.3 | 69.8 | ||||||||||||||||||||||
| 1981-2010 Normals | 4.3 | 6.3 | 8.0 | 7.8 | 6.7 | 6.9 | 6.3 | 0.8 | 0.0 | 0.0 | 0.0 | 0.2 | 40.0 | ||||||||||||||||
| Percent of Normal | 163 | 63 | 81 | 256 | 433 | 48 | 175 | ||||||||||||||||||||||
| Dubois | None | 3.23 | 0.37 | 0.35 | 0.35 | 1.12 | 0.64 | 6.06 | |||||||||||||||||||||
| 1981-2010 Normals | 0.81 | 0.57 | 0.28 | 0.24 | 0.38 | 0.40 | 1.10 | 1.64 | 1.28 | 1.11 | 0.86 | 1.24 | 2.68 | ||||||||||||||||
| Percent of Normal | 399 | 65 | 125 | 146 | 295 | 160 | 226 | ||||||||||||||||||||||
| Snowfall | 19.5 | 5.0 | 8.0 | 7.2 | 25.6 | 13.6 | 78.9 | ||||||||||||||||||||||
| 1981-2010 Normals | 3.0 | 5.8 | 5.1 | 3.9 | 5.7 | 6.0 | 8.5 | 3.9 | 0.6 | 0.0 | 0.0 | 2.6 | 29.5 | ||||||||||||||||
| Percent of Normal | 650 | 86 | 157 | 185 | 449 | 227 | 267 | ||||||||||||||||||||||
| Fossil Butte National Monument |
None | 2.14 | 0.43 | 1.08 | 0.39 | 1.35 | 0.71 | 6.10 | |||||||||||||||||||||
| 1981-2010 Normals | 1.11 | 0.86 | 0.74 | 0.49 | 0.68 | 0.82 | 0.98 | 1.41 | 1.03 | 0.85 | 0.93 | 1.10 | 4.70 | ||||||||||||||||
| Percent of Normal | 193 | 50 | 146 | 80 | 199 | 87 | 130 | ||||||||||||||||||||||
| Snowfall | 6.5 | 6.8 | 14.8 | 8.4 | 20.5 | 8.7 | 65.7 | ||||||||||||||||||||||
| Green River | D0 | 3.10 | 0.15 | 1.10 | 0.05 | 0.35 | 1.05 | 5.80 | |||||||||||||||||||||
| 1981-2010 Normals | 0.81 | 0.41 | 0.44 | 0.34 | 0.43 | 0.71 | 0.85 | 1.23 | 0.98 | 0.55 | 0.68 | 0.90 | 3.14 | ||||||||||||||||
| Percent of Normal | 383 | 37 | 250 | 15 | 81 | 148 | 185 | ||||||||||||||||||||||
| Snowfall | 10.5 | 1.8 | 10.5 | 1.6 | 3.5 | 2.5 | 30.4 | ||||||||||||||||||||||
| 1981-2010 Normals | 0.5 | 3.8 | 6.5 | 4.6 | 7.3 | 5.0 | 3.9 | 0.6 | 0.0 | 0.0 | 0.0 | 0.0 | 27.7 | ||||||||||||||||
| Percent of Normal | 2100 | 47 | 162 | 35 | 48 | 50 | 110 | ||||||||||||||||||||||
| Station Name: COOPS |
Drought Conditions |
Oct 2013 |
Nov 2013 |
Dec 2013 |
Jan 2014 |
Feb 2014 |
Mar 2014 |
Apr 2014 |
May 2014 |
Jun 2014 |
Jul 2014 |
Aug 2014 |
Sep 2014 |
Total for Water Year |
|||||||||||||||
| Jeffrey City | None | 2.08 | 0.17 | 0.72 | 0.39 | 0.13 | 1.13 | 4.62 | |||||||||||||||||||||
| 1981-2010 Normals | 0.91 | 0.59 | 0.42 | 0.31 | 0.41 | 0.86 | 1.27 | 1.85 | 1.15 | 0.89 | 0.60 | 0.80 | 3.50 | ||||||||||||||||
| Percent of Normal | 229 | 29 | 171 | 126 | 32 | 131 | 132 | ||||||||||||||||||||||
| Snowfall | 14.0 | 2.0 | 9.0 | 5.0 | 2.0 | 14.0 | 46.0 | ||||||||||||||||||||||
| 1981-2010 Normals | 7.3 | 6.6 | 5.5 | 4.6 | 6.7 | 9.4 | 10.2 | 4.9 | 0.4 | 0.0 | 0.0 | 1.4 | 40.1 | ||||||||||||||||
| Percent of Normal | 192 | 30 | 164 | 109 | 30 | 149 | 115 | ||||||||||||||||||||||
| Kaycee | None | 3.01 | 0.30 | 0.48 | 0.16 | 0.38 | 0.71 | 5.04 | |||||||||||||||||||||
| 1981-2010 Normals | 1.04 | 0.57 | 0.31 | 0.30 | 0.34 | 0.74 | 1.46 | 2.37 | 1.84 | 1.42 | 0.80 | 1.18 | 3.30 | ||||||||||||||||
| Percent of Normal | 289 | 53 | 155 | 53 | 112 | 96 | 153 | ||||||||||||||||||||||
| Snowfall | 11.5 | 5.0 | 9.5 | 3.2 | 7.1 | 2.0 | 38.3 | ||||||||||||||||||||||
| 1981-2010 Normals | 1.5 | 4.2 | 6.0 | 5.9 | 6.3 | 8.0 | 4.7 | 0.6 | 0.1 | 0.0 | 0.0 | 0.2 | 31.9 | ||||||||||||||||
| Percent of Normal | 767 | 119 | 158 | 54 | 113 | 25 | 120 | ||||||||||||||||||||||
| Moose | None | 1.51 | 1.54 | 2.40 | 1.78 | 4.48 | 4.77 | 16.48 | |||||||||||||||||||||
| 1981-2010 Normals | 1.47 | 2.64 | 2.67 | 2.58 | 1.82 | 1.62 | 1.49 | 1.88 | 1.61 | 1.29 | 1.29 | 1.44 | 12.80 | ||||||||||||||||
| Percent of Normal | 103 | 58 | 90 | 69 | 246 | 294 | 129 | ||||||||||||||||||||||
| Snowfall | 6.0 | 12.4 | 26.5 | 29.8 | 48.3 | 49.5 | 172.5 | ||||||||||||||||||||||
| 1981-2010 Normals | 4.8 | 24.1 | 44.7 | 36.9 | 26.6 | 15.9 | 7.4 | 2.2 | 0.0 | 0.0 | 0.0 | 0.2 | 153.0 | ||||||||||||||||
| Percent of Normal | 125 | 51 | 59 | 81 | 182 | 311 | 113 | ||||||||||||||||||||||
| Old Faithful | None | 1.23 | 2.47 | 2.05 | 1.89 | 2.90 | 6.43 | 16.97 | |||||||||||||||||||||
| 1981-2010 Normals | 1.66 | 2.29 | 3.16 | 2.11 | 1.99 | 2.21 | 2.21 | 2.80 | 2.47 | 1.55 | 1.46 | 1.46 | 13.42 | ||||||||||||||||
| Percent of Normal | 74 | 108 | 65 | 90 | 146 | 291 | 126 | ||||||||||||||||||||||
| Snowfall | 9.0 | 13.5 | 23.5 | 21.0 | 46.0 | 76.5 | 189.5 | ||||||||||||||||||||||
| 1981-2010 Normals | 7.7 | 31.7 | 43.8 | 37.5 | 31.1 | 26.8 | 19.3 | 7.3 | 1.2 | 0.0 | 0.0 | 1.4 | 178.6 | ||||||||||||||||
| Percent of Normal | 117 | 43 | 54 | 56 | 148 | 285 | 106 | ||||||||||||||||||||||
| Powell Field Station | None | 0.66 | 0.07 | 0.08 | 0.18 | 0.65 | 0.15 | 1.79 | |||||||||||||||||||||
| 1981-2010 Normals | 0.56 | 0.18 | 0.13 | 0.21 | 0.13 | 0.29 | 0.51 | 1.40 | 1.35 | 0.87 | 0.52 | 0.65 | 1.50 | ||||||||||||||||
| Percent of Normal | 118 | 39 | 62 | 86 | 500 | 52 | 119 | ||||||||||||||||||||||
| Snowfall | 0.5 | 2.0 | 3.0 | 3.0 | 10.7 | 1.0 | 20.2 | ||||||||||||||||||||||
| 1981-2010 Normals | 1.2 | 1.3 | 1.2 | 2.3 | 0.5 | 2.5 | 0.5 | 0.5 | 0.0 | 0.0 | 0.0 | 0.1 | 9.0 | ||||||||||||||||
| Percent of Normal | 42 | 154 | 250 | 130 | 2140 | 40 | 224 | ||||||||||||||||||||||
| Riverton (downtown) | None | 1.72 | 0.04 | 0.31 | 0.63 | 0.14 | 0.49 | 3.33 | |||||||||||||||||||||
| 1981-2010 Normals | 0.85 | 0.41 | 0.24 | 0.28 | 0.33 | 0.56 | 0.98 | 1.45 | 1.21 | 0.78 | 0.50 | 0.83 | 2.67 | ||||||||||||||||
| Percent of Normal | 202 | 10 | 129 | 225 | 42 | 88 | 125 | ||||||||||||||||||||||
| Snowfall | 9.5 | 1.1 | 5.9 | 10.1 | 4.9 | 5.5 | 37.0 | ||||||||||||||||||||||
| 1981-2010 Normals | 3.7 | 4.3 | 4.8 | 4.8 | 6.0 | 5.9 | 6.1 | 1.2 | 0.0 | 0.0 | 0.0 | 0.3 | 29.5 | ||||||||||||||||
| Percent of Normal | 257 | 26 | 123 | 210 | 82 | 93 | 125 | ||||||||||||||||||||||
| Thermopolis | None | 2.82 | 0.22 | 0.46 | 0.46 | 0.20 | 0.54 | 4.70 | |||||||||||||||||||||
| 1981-2010 Normals | 1.26 | 0.80 | 0.46 | 0.35 | 0.45 | 0.87 | 1.46 | 1.86 | 1.51 | 0.88 | 0.58 | 1.23 | 4.19 | ||||||||||||||||
| Percent of Normal | 224 | 28 | 100 | 131 | 44 | 62 | 112 | ||||||||||||||||||||||
| Snowfall | 9.0 | 4.0 | 10.0 | 6.5 | 4.5 | 1.0 | 35.0 | ||||||||||||||||||||||
| 1981-2010 Normals | 2.4 | 3.7 | 4.5 | 5.6 | 4.6 | 2.5 | 2.8 | 0.4 | 0.0 | 0.0 | 0.0 | 0.2 | 23.3 | ||||||||||||||||
| Percent of Normal | 375 | 108 | 222 | 116 | 98 | 40 | 150 | ||||||||||||||||||||||
| Drought Classifications on April 15, 2014 | XX.X / M – Data partially or completely missing | |||||||||||||||||||||||||||||
Even with a relatively dry summer the 12 month precipitation totals ending on April 20 2014 are impressive.
Star Valley Ranch 30.92 inches
Star Valley Ranch west side 26.80 inches
5 SSE Smoot 25.99 inches
1.5 SE Thayne 24.08 inches