Example of Computer Models Difficulty in Forecasting 10 Days in Advance
Weather forecasts have become quite accurate in the near term given the increasingly sophisticated computer models that provide the primary guidance. However the usefulness of forecast diminishes the further out in time the forecast is made as the models steadily decrease in accuracy. Also models are the primary guidance that is used beyond the first couple of days, and almost exclusively beyond 5-7 days.
It is instructive to examine a series of forecasts made by the same model(GFS) for the same time at successive model runs. The GFS is run 4 times a day, every 6 hours.
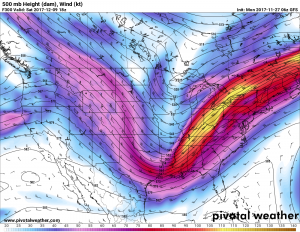
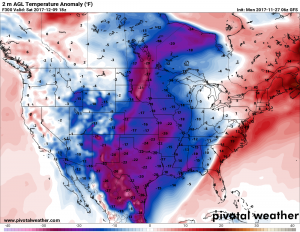
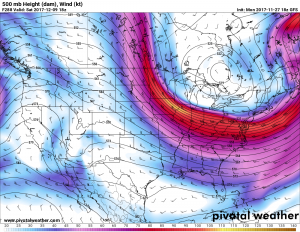
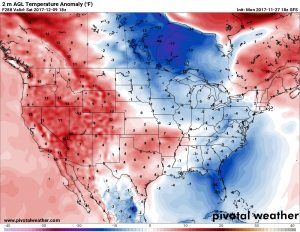
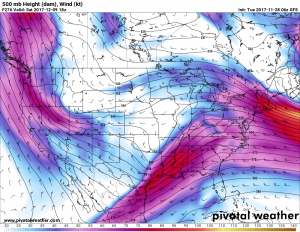
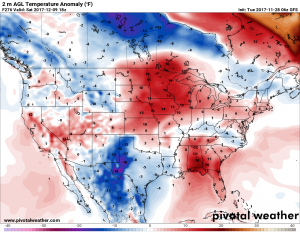
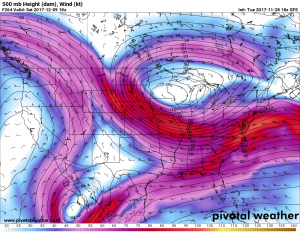
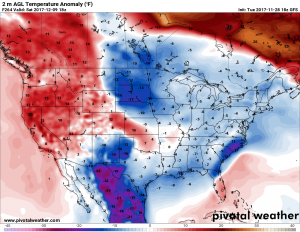
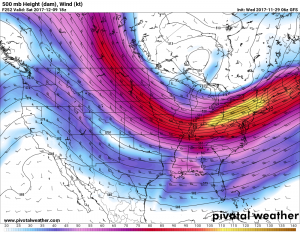
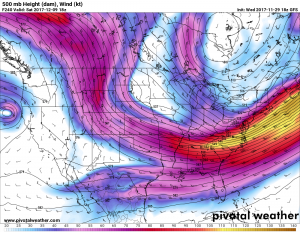
The following model forecasts are all valid for the same time(noon December 9,2017) from the same model(the GFS). The model runs displayed below are every 12 hours, thus the top forecast of both 500mb winds(jet stream locations) and surface temperature anomalies(departure from normal) were solutions from the model run from midnight November 27 2017.
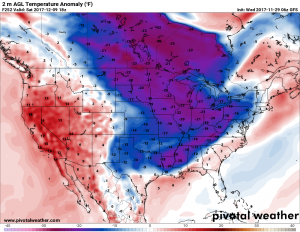
While the difference from model run to model run are considerable across western Wyoming with temperature forecasts ranging from 10 degrees below to 10 degrees above the normal levels, further east across the Plain States noon temperature forecast in any one spot have tremendous variability from 30 below normal to 10 to 20 above normal.
This variability is directly related to the upper jet stream pattern which is the primary controller of delivering cold air from Canada into the Plains. As the forecast time draws nearer(noon December 9 2017) it is likely the model while become more reliable, but at this time(10 days ahead) there is little confidence in the eventual weather, particularly in the Plains.
300 hour forecast for noon December 9 2017
288 hour forecast for noon December 9 2017
276 hour forecast for noon December 9 2017
264 hour forecast for noon December 9 2017
252 hour forecast for noon December 9 2017
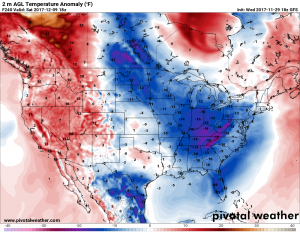
240 hour forecast for noon December 9 2017
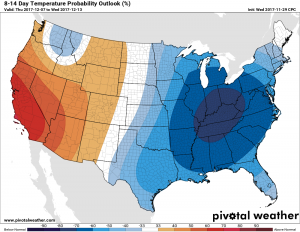
The official temperature forecast covering the period from December 7 to December 13 shows much below normal temperatures in the east and generally above normal in the West. The Great Plains appear to be the area of least confidence as suggested in the uncertainty in the model forecasts as shown above.